Data story · BER ratings · SEAI BER file 26 Sep 2026
Only 1 in 12 homes sold or let in Ireland is B2 or better
We read 265,008 BER certificates SEAI published for homes put up for sale or rent from January 2019 to September 2026. 8.1% were rated B2 or better, the line SEAI’s grant rules use (SEAI BER file, 26 Sep 2026). Where the home is changes that a lot: Dublin 18 has 14 times the share of Dublin 10.

An estate street in Letterkenny, County Donegal.
Landscaped road island in the Old Town housing estate, Letterkenny · Humphrey Bolton · CC BY-SA 2.0

See what your own house could get to
About 10 seconds. See your numbers first, then get quotes if you want them.
8.1%
B2 or better, Ireland
SEAI BER file 26 Sep 2026 · 265,008 certificates
BER assessment9.8%
Dublin, the highest county
90,395 certificates
BER assessment4.2%
Donegal, the lowest county
7,814 certificates
BER assessment14×
Dublin 18 against Dublin 10
28.7% against 2.1%
BER assessmentUpdated · BER file 26 Sep 2026 · How we know · Corrections
Where this sits · the heat chain
A BER is a standard calculation across all four stages. Your bills also depend on how you live.
- Fabricwalls, roof, floor, windows
- Airdraughts and ventilation
- Heatheat pump or boiler, radiators, controls
- Usebills, comfort, the BER
- The idea behind itA BER is a standard calculation
- You are hereBER ratings by county
- Next questionHow do homes in your county compare?
How homes sold or let are rated
SEAI's scale, with the share of homes at each grade. BER assessment
Only 1 in 12 homes sold or let since 2019 is rated B2 or better
Of 265,846 homes sold or let in 2019–26, 8.1% were B2 or better. The commonest grade on the new scale is C (38.5%), and 12.9% are G.
Each arrow is a grade on SEAI's new scale, in the certificate's own colours, with the top of its band beside it in kilowatt-hours per square metre a year. The bar is the share of homes sold or let at that grade: A 1.2%, B 18.9%, C 38.5%, D 13.7%, E 8.8%, F 5.9%, G 12.9%. B2, the national retrofit target from the old scale, sits inside the new B band at 125: all of A plus the first 6.9% of homes in B, 8.1% in all. The median home was 208, a C. A0 also needs no fossil fuel on site, which the file can't test, so A0 homes are counted in A.
Sources: SEAI BER Research Tool, 8 Sep 2026 · Certificates for a sale or private letting assessed 2019–26, 265,846 certificates, one 462-certificate holiday-village batch excluded · S.I. No. 168 of 2026 bands, in force 24 May 2026 · SEAI new-scale sample certificate colours, 8 Sep 2026
The numbers
| Grade | Band, kWh per m² a year | Share |
|---|---|---|
| A0 | 42 or less, and no fossil fuel | in A |
| A | 75 or less | 1.2% |
| B | 75 to 150 | 18.9% |
| C | 150 to 225 | 38.5% |
| D | 225 to 275 | 13.7% |
| E | 275 to 325 | 8.8% |
| F | 325 to 375 | 5.9% |
| G | over 375 | 12.9% |
| B2 or better (old scale) | 125 or less | 8.1% |
How it has changed since 2012
B2 or better, by the year the certificate was done. Different homes each year. BER assessment
1 in 56 homes sold or let was B2 or better in 2012; 1 in 10 in 2025
The share rose from 1.8% in 2012 to 10.3% in 2025. It has been flat since 2024, and part of the rise is the rating method, not works.
Share of BER certificates for a sale or letting rated B2 or better (old scale, 125 or less), by year assessed: 2012 1.8%, 2019 4.6%, 2022 8.0%, 2024 10.3%, 2025 10.3%. The dashed lines mark changes to the rating method: electricity's factor in the standard calculation was lowered in 2018 and again in February 2023, which improved electric-heated homes' ratings with no works done. 2026 is drawn dashed because the file holds January–September, with few certificates after May; never read it as a fall. In 2012 the purpose was recorded on 65% of certificates.
Sources: SEAI BER Research Tool, 8 Sep 2026 · Certificates for a sale or private letting by year assessed, 458,807 certificates, Center Parcs batch excluded
The numbers
| Year | B2 or better | Certificates |
|---|---|---|
| 2012 | 1.8% | 10,478 |
| 2013 | 2.0% | 32,617 |
| 2014 | 2.4% | 31,923 |
| 2015 | 2.3% | 28,322 |
| 2016 | 2.7% | 28,440 |
| 2017 | 2.9% | 30,514 |
| 2018 | 3.0% | 30,667 |
| 2019 | 4.6% | 31,346 |
| 2020 | 5.8% | 27,542 |
| 2021 | 6.7% | 34,180 |
| 2022 | 8.0% | 38,780 |
| 2023 | 8.8% | 36,966 |
| 2024 | 10.3% | 38,663 |
| 2025 | 10.3% | 38,699 |
| 2026 (part) | 9.8% | 19,670 |
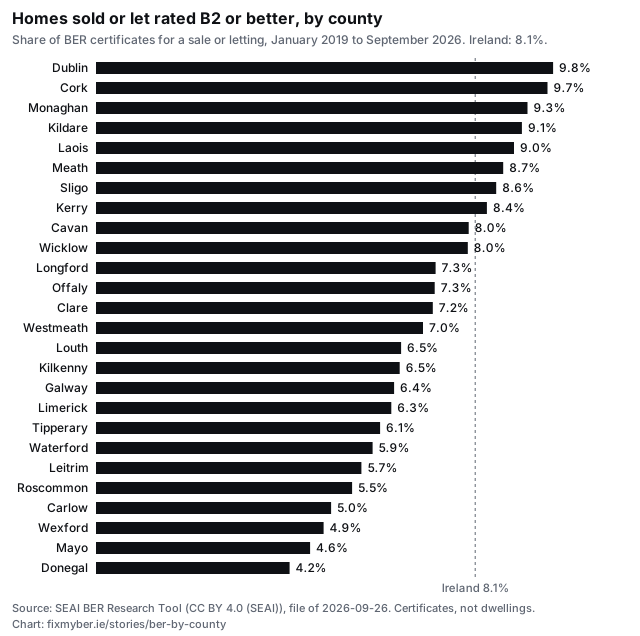
Dublin has the highest share; Donegal the lowest
Every county, homes sold or let. BER assessment
Dublin 9.8%, Donegal 4.2%: B2 or better by county
Ireland: 8.1%. The dashed line is Ireland’s share.
Each bar is the share of a county's BER certificates for a sale or letting, January 2019 to September 2026, rated B2 or better on the old A–G scale, the one SEAI's grant rules still use. Counties with fewer than 100 certificates are indicative only.
Sources: SEAI BER Research Tool (ndber.seai.ie/BERResearchTool), existing-dwelling certificates, CC BY 4.0 (SEAI), 26 Sep 2026
Download the data (CSV)Download this chart (SVG, with its source)
Every county: the rating, the heat pump line and the median
| County | B2 or better | Under the heat pump line | Median BER | Certificates |
|---|---|---|---|---|
| Dublin | 9.8% | 50.1% | 203 | 90,395 |
| Cork | 9.7% | 41.8% | 213 | 27,672 |
| Monaghan | 9.3% | 41.1% | 222 | 2,314 |
| Kildare | 9.1% | 54.2% | 190 | 10,606 |
| Laois | 9.0% | 52.4% | 190 | 4,150 |
| Meath | 8.7% | 51.6% | 191 | 8,303 |
| Sligo | 8.6% | 49.4% | 209 | 4,147 |
| Kerry | 8.4% | 43.8% | 217 | 6,930 |
| Cavan | 8.0% | 52.0% | 196 | 4,070 |
| Wicklow | 8.0% | 41.1% | 204 | 7,739 |
| Longford | 7.3% | 52.6% | 205 | 2,622 |
| Offaly | 7.3% | 43.6% | 208 | 3,359 |
| Clare | 7.2% | 43.7% | 214 | 6,052 |
| Westmeath | 7.0% | 46.9% | 205 | 5,339 |
| Louth | 6.5% | 43.0% | 211 | 6,540 |
| Kilkenny | 6.5% | 43.7% | 208 | 3,917 |
| Galway | 6.4% | 50.1% | 211 | 12,593 |
| Limerick | 6.3% | 46.0% | 211 | 10,764 |
| Tipperary | 6.1% | 36.9% | 232 | 7,050 |
| Waterford | 5.9% | 43.7% | 211 | 7,204 |
| Leitrim | 5.7% | 42.9% | 215 | 2,441 |
| Roscommon | 5.5% | 38.3% | 227 | 3,590 |
| Carlow | 5.0% | 44.5% | 209 | 3,291 |
| Wexford | 4.9% | 40.9% | 217 | 8,810 |
| Mayo | 4.6% | 40.9% | 226 | 7,296 |
| Donegal | 4.2% | 36.0% | 222 | 7,814 |
Median BER in kWh/m²/yr. * Fewer than 100 certificates: indicative only. SEAI BER file 26 Sep 2026.
Inside Dublin, Dublin 18 has 14 times the share of Dublin 10
Every Dublin postal district, homes sold or let. The spread is far wider than between counties. BER assessment
Every Dublin postal district
| District | B2 or better | Under the heat pump line | Median BER | Certificates |
|---|---|---|---|---|
| Dublin 18 | 28.7% | 73.8% | 147 | 4,627 |
| Dublin 20 | 17.5% | 55.8% | 190 | 995 |
| Dublin 13 | 15.5% | 49.0% | 181 | 2,509 |
| Dublin 6W | 11.1% | 35.0% | 238 | 1,623 |
| Dublin 4 | 10.9% | 50.8% | 207 | 4,732 |
| Dublin 17 | 10.4% | 58.6% | 189 | 996 |
| Dublin 15 | 10.3% | 64.4% | 180 | 7,095 |
| Dublin 16 | 10.2% | 42.9% | 200 | 2,382 |
| Dublin 2 | 10.0% | 67.8% | 201 | 1,813 |
| Dublin 14 | 9.8% | 35.9% | 219 | 3,102 |
| Dublin 11 | 8.9% | 53.5% | 203 | 3,527 |
| Dublin 24 | 8.3% | 63.9% | 195 | 4,831 |
| Dublin 1 | 7.8% | 67.5% | 204 | 2,949 |
| Dublin 8 | 7.1% | 56.3% | 215 | 5,168 |
| Dublin 6 | 7.0% | 41.4% | 231 | 3,022 |
| Dublin 9 | 6.6% | 39.1% | 226 | 3,986 |
| Dublin 12 | 5.9% | 30.1% | 263 | 3,590 |
| Dublin 3 | 4.7% | 37.8% | 238 | 3,423 |
| Dublin 7 | 3.7% | 37.6% | 253 | 4,063 |
| Dublin 5 | 3.3% | 18.6% | 274 | 2,514 |
| Dublin 22 | 2.1% | 46.0% | 218 | 2,230 |
| Dublin 10 | 2.1% | 27.7% | 261 | 758 |
Median BER in kWh/m²/yr. * Fewer than 100 certificates: indicative only. Areas under 30 certificates are not shown.
The data, and how to cite it
Cite as: FixMyBER analysis of the SEAI BER Research Tool (CC BY 4.0 (SEAI)), certificates for a sale or letting, January 2019 to September 2026. File of 26 Sep 2026. fixmyber.ie/stories/ber-by-county
Quote the figures freely with a link to this page; the chart and the spreadsheet are yours to reuse on the same terms. Questions about the method: info@usecara.ie.
How we know
- Which certificates: Every existing-home BER certificate SEAI publishes, filtered to those done for a sale or a private letting (265,008 from January 2019 to September 2026). Grant certificates are left out: they are done after the works, so they would make the typical home look better than it is.
- What they count: These are published BER certificates, not dwellings. A home certified twice counts twice, and homes that never change hands are missing.
- B2 or better: On the old A–G scale, the one SEAI's grant rules still use. "Under the heat pump line" is a heat loss indicator of 2.3 or below, from certificates since July 2022.
- Two files: The county and district tables read the BER file of 26 Sep 2026; the scale and the trend (figures 1 and 2) the site's file of 8 Sep 2026. The shares agree to a tenth of a point.
Sources
SEAI BER Research Tool (ndber.seai.ie/BERResearchTool), existing-dwelling certificates, CC BY 4.0 (SEAI), 26 Sep 2026
Found a mistake? Every fix is dated on Corrections. Method in full: How we know.
See your grants and what you’d pay
Four questions about your home, then your numbers. Get quotes from registered contractors if you want them.
Updated · BER file 26 Sep 2026 · How we know · Corrections