Data story · Heat pumps · SEAI BER file 8 Sep 2026
Almost half of homes sold or let are already under the heat pump line
SEAI’s heat pump grant asks most older homes for a technical assessment, unless a BER shows a heat loss indicator of 2.3 or below. Of 161,297 certificates for a sale or letting since July 2022, 46.6% were at or under it (SEAI BER file, 8 Sep 2026). For 1 in 10 more, one job stands between the home and the line.

Semi-detached houses and terraces in a 2000s estate near Naas, County Kildare.

See where your own house sits, and what gets it under
About 10 seconds. See your numbers first, then get quotes if you want them.
46.6%
At or under 2.3: no technical assessment
SEAI BER file 8 Sep 2026 · 161,297 certificates
BER assessment10.0%
Just over the line, 2.3 to 2.5
SEAI BER file 8 Sep 2026 · 161,297 certificates
BER assessment93%
Of those, brought under by one job
One job at a time, on each certificate's own figures · research copy of the 26 Sep 2026 file
Our model84%
Of those, by replacing the windows alone
The single job that most often does it · research copy of the 26 Sep 2026 file
Our modelUpdated · grants checked · BER file 8 Sep 2026 · research copy 26 Sep 2026 · How we know · Corrections
Where this sits · the heat chain
Heat leaves through the walls, roof, floor, windows and draughts. The heating puts it back. A BER adds it all up.
- Fabricwalls, roof, floor, windows
- Airdraughts and ventilation
- Heatheat pump or boiler, radiators, controls
- Usebills, comfort, the BER
- The idea behind itFabric first: the heat-loss line
- You are hereHow many homes are heat pump ready
- Next questionIs your house ready for a heat pump?
The line, and where homes sit against it
SEAI's rule, then every certificate with a heat loss figure since July 2022. BER assessment
Homes built before 2007 need a technical assessment, unless a BER shows low heat loss. SEAI rule
Homes built before 2007: A Technical Assessment is required if you do not have a valid BER assessment or if your BER Assessment indicates your dwelling has a high heat loss.
Heat pump systems grant, 10 Oct 2026
A valid BER with a heat loss indicator of 2.3 or less means no assessment. SEAI rule
You do not need one if your valid BER says your Heat Loss Indicator is equal to or less than 2.3 W/(K.m2).
Heat pump systems grant, 10 Oct 2026
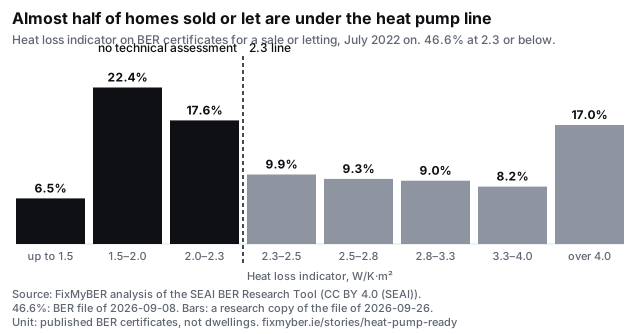
46.6% of homes sold or let are at or under the line; 1 in 10 sit just over it
For the homes just over, one job alone brings 93% under: replacing the windows 84%, topping up the attic 47%, blocking unused chimneys and flues 19%, insulating the walls 17%.
Each bar is the share of BER certificates done for a sale or a private letting in one band of heat loss indicator, from July 2022, when SEAI starts publishing the figure. Black bars are at or under 2.3, the line below which SEAI asks for no technical assessment before the heat pump grant. These are certificates, not homes: a home certified twice counts twice. The bars are from a research copy of the 26 Sep 2026 file; the 46.6% is from the BER file of 8 Sep 2026, the one the rest of the site uses.
Sources: SEAI BER Research Tool (ndber.seai.ie/BERResearchTool), existing-dwelling certificates, CC BY 4.0 (SEAI), 8 Sep 2026 · SEAI BER Research Tool (ndber.seai.ie/BERResearchTool), existing-dwelling certificates, research copy, CC BY 4.0 (SEAI), 26 Sep 2026
Download the data (CSV)Download this chart (SVG, with its source)
Age matters more than anything else
The share under the line, by house type and when it was built. BER assessment
96% of semi-detached houses built 2005–2010 are under the line; 15% of those built 1970–1989
Under each share: for the homes over the line, the one job that most often gets them under, and how often.
| Built | Detached | Semi-detached | Mid-terrace | Apartment |
|---|---|---|---|---|
| Before 1940 | 4%Insulating the walls: 5% | 9%Insulating the walls: 12% | 12%Insulating the walls: 22% | 23%Insulating the walls: 32% |
| 1940–1969 | 6%Insulating the walls: 3% | 8%Insulating the walls: 12% | 14%Insulating the walls: 30% | 24%Insulating the walls: 31% |
| 1970–1989 | 8%Replacing the windows: 8% | 15%Insulating the walls: 19% | 41%Insulating the walls: 43% | 44%Insulating the walls: 41% |
| 1990–2004 | 34%Replacing the windows: 45% | 52%Replacing the windows: 75% | 91%Replacing the windows: 68% | 79%Replacing the windows: 48% |
| 2005–2010 | 84%Replacing the windows: 55% | 96%Replacing the windows: 61% | 98% | 90%Replacing the windows: 48% |
| 2011 on | 95% | 98% | 98% | 96% |
Bold: the share at 2.3 or below. Underneath: of the homes over the line, the share that one job alone brings under it, shown where at least 150 homes are over the line. Not modelled for homes built 2011 on. From a research copy of the 26 Sep 2026 file.
EstimateThe one-job lines are our model: each certificate's own figures, worked out one job at a time. Not the official BER calculation, and not an assessment of any house.
Sources: SEAI BER Research Tool (ndber.seai.ie/BERResearchTool), existing-dwelling certificates, research copy, CC BY 4.0 (SEAI), 26 Sep 2026
Kildare has the most homes under the line; Donegal the fewest
Every county, homes sold or let. BER assessment
Kildare 54.2%, Donegal 36.1%
Ireland: 46.6%. Counties with fewer than 100 certificates are marked with a star.
Each bar is a county's share of sale and letting certificates with a heat loss indicator of 2.3 or below, from July 2022. A county's figure says nothing certain about one house in it.
Sources: SEAI BER Research Tool (ndber.seai.ie/BERResearchTool), existing-dwelling certificates, CC BY 4.0 (SEAI), 8 Sep 2026
The numbers
| County | At 2.3 or below | Certificates |
|---|---|---|
| Kildare | 54.2% | 6,479 |
| Longford | 52.7% | 1,603 |
| Laois | 52.4% | 2,570 |
| Cavan | 51.9% | 2,432 |
| Meath | 51.7% | 5,152 |
| Galway | 50.2% | 7,651 |
| Dublin | 50.1% | 55,366 |
| Sligo | 49.5% | 2,539 |
| Westmeath | 47.0% | 3,370 |
| Limerick | 46.0% | 6,447 |
| Carlow | 44.7% | 1,902 |
| Kerry | 43.8% | 4,052 |
| Kilkenny | 43.8% | 2,226 |
| Waterford | 43.7% | 4,368 |
| Clare | 43.6% | 3,652 |
| Offaly | 43.5% | 2,036 |
| Louth | 43.1% | 3,907 |
| Leitrim | 43.0% | 1,488 |
| Cork | 41.9% | 17,114 |
| Monaghan | 41.3% | 1,408 |
| Mayo | 41.0% | 4,418 |
| Wicklow | 41.0% | 4,893 |
| Wexford | 40.9% | 5,405 |
| Roscommon | 38.5% | 2,160 |
| Tipperary | 37.1% | 4,261 |
| Donegal | 36.1% | 4,398 |
The data, and how to cite it
Cite as: FixMyBER analysis of the SEAI BER Research Tool (CC BY 4.0 (SEAI)), certificates for a sale or letting with a heat loss indicator, July 2022 on. File of 8 Sep 2026; heat loss bands, house type and age, and the one-job model from a research copy of the 26 Sep 2026 file. fixmyber.ie/stories/heat-pump-ready
Quote the figures freely with a link to this page; the chart and the spreadsheet are yours to reuse on the same terms. Questions about the method: info@usecara.ie.
How we know
- Which certificates: Every existing-home BER certificate SEAI publishes with a heat loss indicator, done for a sale or a private letting: 161,297 since July 2022, when the figure starts being published. Grant certificates are left out, because they are done after the works.
- What they count: These are published BER certificates, not dwellings. A home certified twice counts twice, and homes that never change hands are missing. Counties with fewer than 100 certificates are marked.
- Which file: The national and county shares are from SEAI's BER file of 8 Sep 2026, the one every page on this site uses. The heat loss bands, the house type and age table and the one-job model are from a research copy of the 26 Sep 2026 file, which we have not yet re-run on the 8 Sep 2026 file. The two agree to within 0.1 of a point.
- One job: Modelled from each certificate's own figures, one job at a time: new windows, the attic to the grant standard, wall insulation, draught-proofing, blocking unused chimneys. The model matches SEAI's published figure to a median ratio of 1.00.
Sources
SEAI BER Research Tool (ndber.seai.ie/BERResearchTool), existing-dwelling certificates, CC BY 4.0 (SEAI), 8 Sep 2026 · SEAI BER Research Tool (ndber.seai.ie/BERResearchTool), existing-dwelling certificates, research copy, CC BY 4.0 (SEAI), 26 Sep 2026
Found a mistake? Every fix is dated on Corrections. Method in full: How we know.
See your grants and what you’d pay
Four questions about your home, then your numbers. Get quotes from registered contractors if you want them.
Updated · grants checked · BER file 8 Sep 2026 · research copy 26 Sep 2026 · How we know · Corrections